#1 ·
InTruthWeTrust said:Are you thinking of... say, NASCAR or IndyCar? 😳 To be fair, they really are lagging behind when it comes to aerodynamics.👎 But just look at those engines—they’re so much more powerful than Formula 1! 👍
Could you walk me through... specifically regarding the last couple of seasons... how the V8s used by the top teams compare to those restricted V10s? How does that horsepower actually manifest in one versus the other? And how is it possible for a V10 to end up being weaker?😕
Where are you getting the idea that they're more powerful?
I don't have the exact specs in front of me, but I highly doubt they've got more juice; those late-era V10 engines were pushing north of 980 hp, whereas these V8s are likely sitting right around or just over 800.
When it comes to the power gap between a V8 and a restricted V10, you have to look at what we call the power curve and the torque curve (check out the examples below). Both curves are plotted against RPM, which means both power and torque are entirely dependent on how fast the engine is spinning.
That’s why you’ll often see a spec like 154 BHP @ 6300 RPM (meaning 154 horsepower at 6300 revolutions per minute).
Peak power doesn't always hit at the absolute redline; it usually peaks somewhere near the redline, depending on the specific car and engine setup.
With Formula 1 engines, once they capped those V10s at 16,700 RPM (??), they essentially lopped off a massive chunk of that curve—specifically the highest part—so the engines simply became less powerful.
Here are two examples, a gasoline engine and a diesel:
Ford Focus 2.0L
Power: 138BHP / 103kW @ 6000 rpm (red curve)
Torque: 190Nm @ 4100 rpm (blue curve)

Ford Focus 2.0L Diesel
Power: 90HP / 67kW @ 4000 rpm (red curve)
Torque: 205Nm @ 1750 rpm (blue curve)

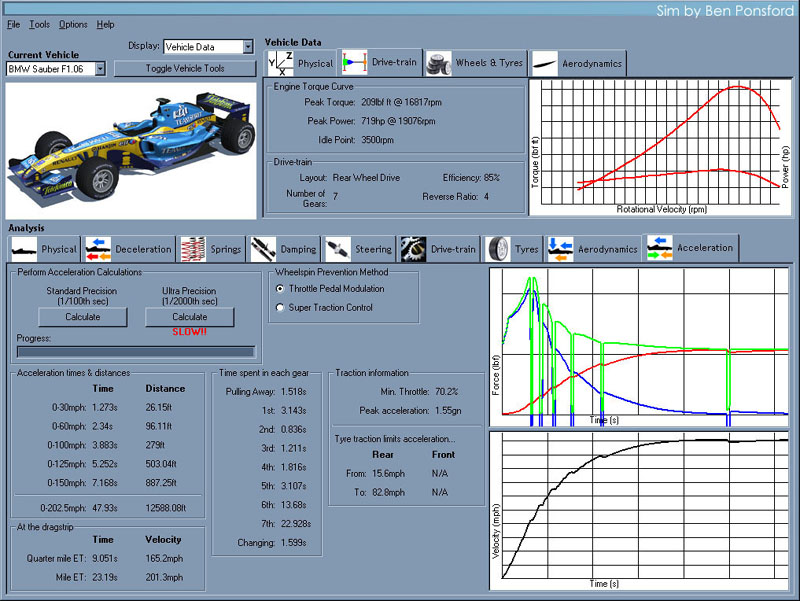
And as a final thought, here is a simulation of the General Motors engine from 2006 (it isn't official data, just a simulation, but it should be close enough).