#3621 ·
Chloe Sanchez15 said:
Hello,
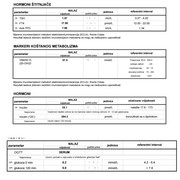
Could you please help me interpret these results? Is there any sign of insulin resistance here, specifically regarding this insulin value after 120 minutes?
In other results from last week, my ferritin was 11.3 ng/l (ref. 13.0-150) and iron was 90 ng/l (ref. 33-193).
Thanks so much in advance.
Hello,
Based on the calculations, the HOMA-IR index comes out to 1.16 (normal is under 1.6) and the Matsuda index is 9.86 (normal is above 2.5). Based on these specific metrics, there are no indicators of insulin resistance in this report. As for that 120-minute insulin level, I looked at two different sources, both of which suggest a value of 294.2 pmol/L is still within the acceptable range. For instance, the Williams Textbook of Endocrinology (13th ed., Philadelphia: Elsevier) lists the 120-minute reference range between 111-1153 pmol/L, while Quest Diagnostics provides a range of 35 to 380 pmol/L. Reference values fluctuate quite a bit depending on the literature used, but according to most sources, your 294.2 pmol/L falls within the normal spectrum.
For a more granular view, an extended OGTT would be necessary—measuring insulin at 30, 60, 120, and 180 minutes—to pinpoint exactly when peak insulin concentrations occur and determine the specific type of insulin curve.
Regarding the ferritin levels: they are low, which points toward depleted iron stores in the body. However, it would be useful to see the TIBC to calculate transferrin saturation.